Status code and response time
Every check records the HTTP status and how long the site took to answer, so a site that is slowing down shows up before it falls over.
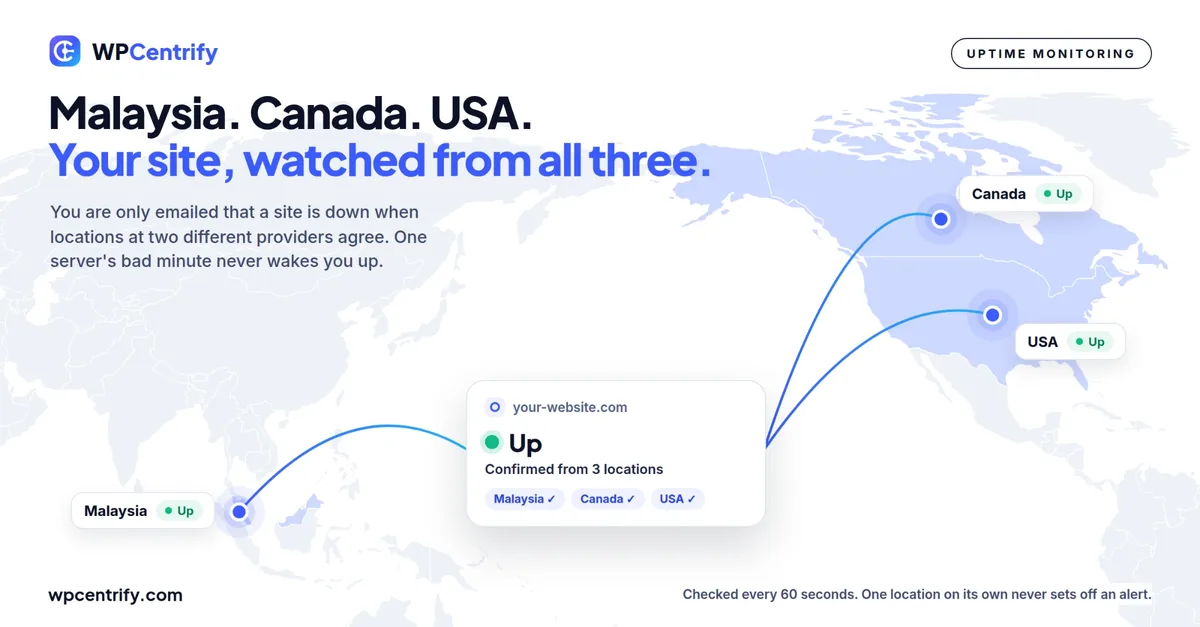
Every WordPress site you manage is checked every 60 seconds from Malaysia, Canada and the USA. You are emailed only when locations on different providers agree a site is down, so one server's bad minute never wakes you up.
Included on every plan. No add-on pricing.
Updated
WordPress uptime monitoring is an outside service that requests your site on a schedule, checks that it answers correctly and quickly, and alerts you the moment it does not. It runs from outside the site on purpose: a plugin inside WordPress cannot report that WordPress is down.
A good uptime monitor answers three questions for every site: is it reachable, is it serving the right page, and is it getting slower. WPCentrify answers them for every site you connect, from one dashboard, and keeps the history so you can show a client what happened and when. New to the topic? Our guide to website uptime monitoring explains checks, intervals and uptime percentages, with no vendor pitch, and our comparison of website uptime monitoring software sets nine tools side by side.
Most WordPress outages are not dramatic server failures. They are a PHP memory limit hit during a traffic spike, an expired SSL certificate, a database connection used up by a slow query, or a plugin update that took the site down at 2am on a Sunday. They are short, they are invisible unless something is watching, and they damage the relationship when the client notices first. When a site does go down, the WordPress site down checklist works through the causes in order.
Many free monitors check every five minutes from a single location. A five minute gap lets an outage run for several minutes before anyone looks, and a single location turns a routing problem near the checker into a 3am alert about a site that was fine all along.
Every 60 seconds, each site is requested from three locations on three continents, run on more than one provider.
Covers Asia and the Pacific, where a checker in North America cannot see what your visitors see.
A second view of North America, so a regional problem on one side of the continent is not mistaken for an outage.
The view most of your visitors share, checked on the same 60 second cycle.
An uptime alert is only useful if you trust it. When one checker loses its route to your server, a single-location monitor reports the site as down even though every real visitor can reach it. WPCentrify treats that as noise.
A site is only reported down when locations on different providers agree, and only after three failed checks in a row. Locations on the same provider can share the same bad network day; different providers rarely do. It is marked back up after two successful checks.

From the first failed request to the incident closing, without anyone watching a screen.
The site times out, returns an error, or serves the wrong page. Nothing is sent yet: one failure from one place is not enough to call an outage.
All three locations carry on. If the failure was a network problem near one checker, the next checks pass and the blip is simply part of the record.
After three failed checks in a row, with locations on different providers seeing the failure, the site is marked down and an incident opens with its start time, the error returned and which locations saw it.
One alert per confirmed outage, not one per failed check. It lands while the outage is still minutes old, usually before the client has noticed.
Two successful checks in a row mark the site up again. The incident closes with its duration, and the downtime counts against that site's uptime figure and SLA.
A WordPress site can return HTTP 200 while showing a database error or a white screen. Uptime monitoring that only reads the status code will call that a healthy site.
Every check records the HTTP status and how long the site took to answer, so a site that is slowing down shows up before it falls over.
Checks look for content that should be on the page, catching the white screen, the database error and the maintenance page that never went away.
Watch a checkout, a booking form or a landing page, not only the home page. The pages that earn money are the ones worth checking.
Authenticated checks reach a dashboard, account area or checkout step that anonymous visitors never see.
WordPress SSL monitoring warns you well before a certificate expires, so visitors never meet a browser security warning.
Domain renewals and unexpected DNS changes are flagged, two causes of downtime that no amount of server monitoring will catch.
A form that quietly stops sending is a silent failure too, which is why inquiries from every site are collected in one place.
When an outage is confirmed you get one email with the site, the time it went down, the error that came back and the locations that saw it. Failed checks that never became an outage stay in the log instead of your inbox.
An example alert. Sites and times are illustrative.
Start time, end time, duration, the error returned and which locations saw the failure, recorded without anyone writing it down.
The incident sits next to what else happened: an update that ran, a plugin that changed or a certificate that expired. If a bad update caused it, safe updates with automatic rollback stop it happening again.
If you promise 99.9 percent, WPCentrify measures each site against that number and warns you before the month's downtime budget is spent.
Uptime flows into the report the client receives, the client portal and status pages. Nobody screenshots a graph.
Uptime is the share of time a site was reachable. The difference between targets looks tiny as a percentage and is huge in minutes.

| Uptime | Per 30-day month | Per year |
|---|---|---|
| 99% | 7 h 12 min | 3 days 15 h 36 min |
| 99.5% | 3 h 36 min | 1 day 19 h 48 min |
| 99.9% | 43 min 12 s | 8 h 45 min 36 s |
| 99.95% | 21 min 36 s | 4 h 22 min 48 s |
| 99.99% | 4 min 19 s | 52 min 34 s |
99.9 percent is the usual promise in a WordPress care plan and a sensible default for business sites. Promise only what the hosting can deliver, then measure it properly: a monitor that checks every five minutes cannot tell you whether a site met a 43 minute budget. Our guide to WordPress client reporting covers how to show the number to clients.
Monitoring one site is easy. Monitoring forty means you need the worst problems first and nothing else shouting. Uptime is one part of how WPCentrify helps you manage multiple WordPress sites from one place, and our guide to WordPress site monitoring covers the other checks worth running.
What people ask before they turn it on.
WordPress uptime monitoring is an outside service that requests your site on a schedule, checks that it answers correctly and quickly, and alerts you when it does not. WPCentrify checks every connected WordPress site every 60 seconds from Malaysia, Canada and the USA, and emails you when an outage is confirmed.
Every 60 seconds, from each of three locations: Malaysia, Canada and the USA. That cycle runs around the clock for every site you connect, on every plan.
A failure is seen within 60 seconds of it starting. Before anyone is emailed, the site has to fail three checks in a row and locations on different providers have to agree it is down, so the email reaches you a few minutes into a real outage rather than seconds into a network blip.
Far fewer than with a single-location monitor. One location on its own never sets off an alert, because a routing problem near one checker is not your site being down. An alert needs three failed checks in a row and agreement between locations on different providers, and a site is marked recovered after two successful checks.
By email. You get one email when an outage is confirmed, not one per failed check. Maintenance windows hold alerts back while you are doing planned work on a site.
No. The checks are ordinary requests made from outside the site, one per location per minute, which is far less than a single visitor browsing a few pages. Nothing runs inside WordPress to make them happen.
Yes. Authenticated monitoring can check a dashboard, account area or checkout step that anonymous visitors never see, so a broken login or checkout is caught even when the home page looks fine.
Most care plans promise 99.9 percent, which allows about 43 minutes of downtime in a 30-day month. Only promise what the hosting can deliver, and measure against it. WPCentrify tracks each site against the figure you set and warns you before the month is used up.
Yes, through the white-labeled client portal or a status page on your own domain. Uptime also appears in the monthly client report automatically.
For a single site, a general uptime service may be enough. For several WordPress sites, WPCentrify checks every site every 60 seconds from 3 locations in Malaysia, Canada and the USA, sends an email alert only when locations on different providers agree the site is down after three failed checks in a row, and keeps each site's uptime next to its updates, backups and security.
Yes. Several uptime services have free plans, and WPCentrify's uptime monitoring is free during early access. When you compare free plans, check how often they look at your site and whether an outage is confirmed from more than one location before you are alerted.
Yes. Alongside the 60-second checks, WPCentrify watches each site's SSL certificate and its domain registration, and warns you by email before the domain expires.
Core Web Vitals and speed over time, for the slowdowns uptime only hints at
Read moreCatches the broken page that still returns HTTP 200 after an update
Read moreThe other thing worth watching on every site, every day
Read moreConnect a site in under two minutes and it is checked from Malaysia, Canada and the USA from then on. Free during early access.
Free during early access. Keep your data, export any time.